Recent online shopping statistics have found that over two-thirds of Americans have made an online purchase. According to ComScore, this equates to approximately 78% of the entire population that’s over the age of 15.
Needless to say, ecommerce is big business, and isn’t going anywhere, anytime soon. We’ve highlighted this nuance in a recent guide we penned: Bricks vs. Clicks: How the Ecommerce Monster is Slowly Ingesting Brick & Mortar Retail. Look to it for more insight on how brick and mortar is slowly but surely being overtaken by ecommerce (even though it will never cease to be; ecommerce is catching up fast).
Gender Spending Nearly Equal
During the first quarter of 2014 (the same time which ComScore developed the report we referenced above), some related online shopping stats were also found by Business Insider that deliver the following tidbits of data.
- Men spend nearly as much as women do on ecommerce, even though women typically control 80% of all household budgets.
- Men outpace women with mobile spending at a rate of 22% to 18%.
- Millennials are the most targeted to online spenders, and open their wallets to the tune of about $2,000 per year, more than any other demographic.
- Baby boomers and older Americans account for 25% of online shoppers.
- Ecommerce’s biggest spenders (about 55%) have household earnings that exceed $75,000 per year (boomers and millennials).
Comparison Shopping On the Rise
With a number of online shopping holidays looming in the not-so-distant future – like Black Friday, Cyber Monday, and the onset of August, which denotes the start of the holiday shopping season for e-retailers – make sure you are prepared for the webrooming and showrooming that’s certain to take place by understanding these related online shopping statistics.
- Showrooming is the most commonly used tactic to find deals (showrooming is where you shop locally but then compare prices online to find the best price), RIS says that 42% of Americans routinely use this strategy to get lower prices on goods.
- Mobile apps are reducing comparison shopping for consumers, so explains ComScore, because about 46% of shoppers say that they are less likely to comparison shop when using a mobile app (namely because you must open a new mobile web window outside of that app).
- Some shoppers will outright leave a store after comparing a deal they find to one that’s online from their phone, provided they find a better online deal. RIS says that about 19% of consumers will follow this habit, ultimately taking their business to the lower priced ecommerce store they found that offers the same or similar product.
Digital Coupons
Let’s not overlook the power of digital coupons, either. You can get a complete breakdown in our 2015 Digital Coupon Statistics guide. But here are some quick facts for you.
- According E Marketer, over 70% of mobile shoppers rely upon digital coupons to find the best deals, with this usage expected to increase in 2015.
- An Internet Retailer report found that over 66 million digital coupons were redeemed in 2013, with estimates pegging this number at about 75 million for the present year.
- In a recent Experian study, it was found that digital coupons have a healthy open rate of 14%; they increase unique clicks by 34%; they improve transaction completion by 27%; and they add over 47% in revenue to an email marketing campaign.
The Ecommerce Growth Timeline
While ecommerce had been growing since the dotcom boom in the early 90s, but was subsequently curtailed briefly when a lot of tech, ecommerce and marketplace startups failed during that decade, its real surge wouldn’t take hold until early in the 2000’s. That’s when things began really heating up in the ecommerce oven, and most experts agree that 2008 was the benchmark year that the cookies were finally done.
2008 Set New Benchmarks
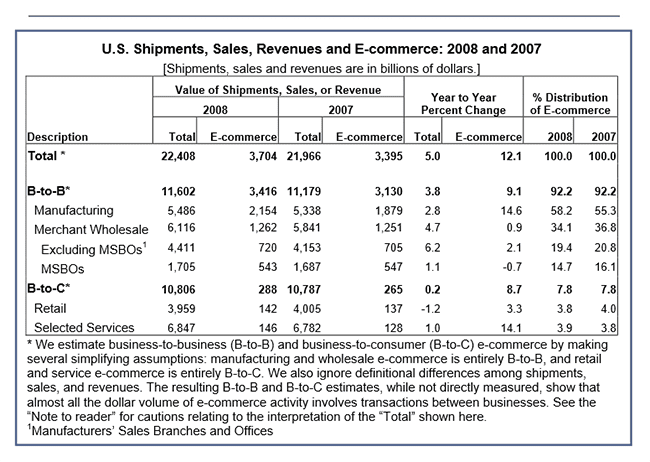
The U.S. Census Bureau reports that during 2008, ecommerce was the fastest growing industry in their “E Stats” report. It specifically notes that transactions between merchant wholesalers and manufacturers accounted for 92% of all growth. Think: big online store stocks up its warehouses from big manufacturer and then sells the wares to the consumer online.
But manufacturers claimed the biggest slice of the e-retail pie during this period, accounting for $2.154 billion or 39% of all shipments that were made. Take a look at the chart below, courtesy of the U.S. Census Bureau, for more clarity.
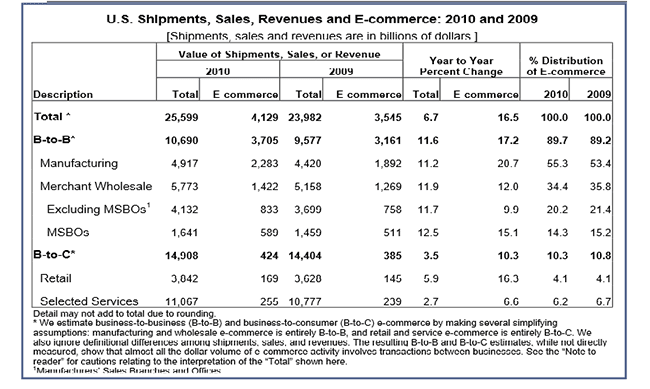
 2009-2010 Broke All Records
While 2008 was a landmark year, it paled in comparison to what was yet to come. According to the U.S. Census Bureau, ecommerce once again grew faster than any other sectors in its annual “E Stats” report. Manufacturers and merchants were once again the top breed for revenue, with manufacturers and wholesalers accounting for over 90% of all ecommerce revenue.
Retailers in ecommerce saw their sales increase sharply from the years prior, too, to the tune of 16.3%. Ecommerce finally got its feet wet and created a little, teeny, tiny dot on the retail map for itself, now measuring at approximately 4.4% of all retail sales in the U.S. In 2009, ecommerce was raking in $145 billion in annual sales; but just a year later, it was pulling in $169 billion.
 2012-2014 Set the Bar High
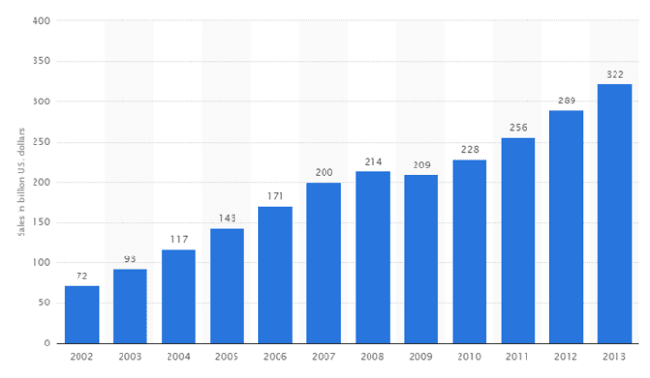
Most recently, the years 2012-2014 were enormous for ecommerce, and represent the most interesting of all online shopping statistics to date. The year 2012 saw ecommerce break a number that it had never neared before, the ubiquitous one-trillion marker.
Year over year, from 2011 to 2012, ecommerce grew by a staggering and impressive 21.1%, according to E Marketer. This massive growth helped it finally breach $1 trillion, with an equally as impressive 18.3% in growth following it in 2013, helping it drive over $1.298 trillion in worldwide sales.
This unparalleled growth wouldn’t stop soon, either. Findings by the U.S. Census Bureau show that Americans spent $78 billion during the third quarter of 2014, as compared to just $67.1 billion during the third quarter of 2013. This healthy number also rounded out ecommerce’s increasing stake in retail sales. In all, e-retail grew from being just 5.9% of U.S. retail to 6.6%, representing a substantial gain year over year.
Online Shopping Trends & Predictions
Now that we’ve covered the recent epistemology of ecommerce, what do these online shopping statistics tell us for what lies ahead? Here are some predictions for 2015, some of which are already vetting rather nicely.
- Baby boomers and millennials are the driving force of ecommerce. With both demographics spending more online and on mobile than any other demographic combined.
- Social media is becoming a shopping portal. Newer Facebook and Twitter “buy” buttons further this metric, allowing consumers to shop and make purchases from within their selected platform (and device) of choice.
- Corporate responsibility will influence over 87% of consumers around the world, explains a survey conducted by Cone Communications and Echo Research.
- Big data will be the fuel of the new ecommerce vehicle, says Oracle, and retailers will rely upon it enormously for their marketing decisions.
- Data breaches will be better managed and prevented to improve consumer confidence, according to Chain Store Age, so that people don’t worry about their personal information getting stolen when they go shopping.
- More online-only brands will convert to the double-model and open brick and mortar locations, explains Vend HQ.
- Omni channel loyalty will win over the day, says Media Post, with click and collect options being the most favored by consumers.
The Cyber Monday Effect
Of the most popular days to shop online throughout the year, Cyber Monday still reigns supreme, and has turned into an internet and online shopping holiday of sorts in recent years, too, according to the most recent internet shopping statistics. The term was coined by the National Retail Federation in 2005, when they used it to illustrate a traceable link in sharp online sales increases that occurred during the first Monday to follow Thanksgiving, according to IB Times.
Just seven years later, in 2013, the term would continue to hold true to its original definition and coining. A CMO report found that this year saw a record in Cyber Monday sales, with the net tally exceeding $2.29 billion in just a single day.
In a PFS Web report, the following Cyber Monday online shoppers statistics statistics were noted from 2014:
- Total orders were up by 15% from 2013.
- Total online sales were up by 8.5% from 2013.
- Smartphones accounted for 28.5% of traffic.
- Tablets accounted for 12.5% of traffic.
- Average smartphone user spent $99.61.
- Average tablet user spent $121.24.
- Desktop users dropped an average of $128.24, an increase of 20% from 2013.
- Average Facebook referral netted $123.44 in sales.
- Average Pinterest referral netted $97.78 in sales.
- Cyber Monday peak shopping time was between 9-10 PM EST.
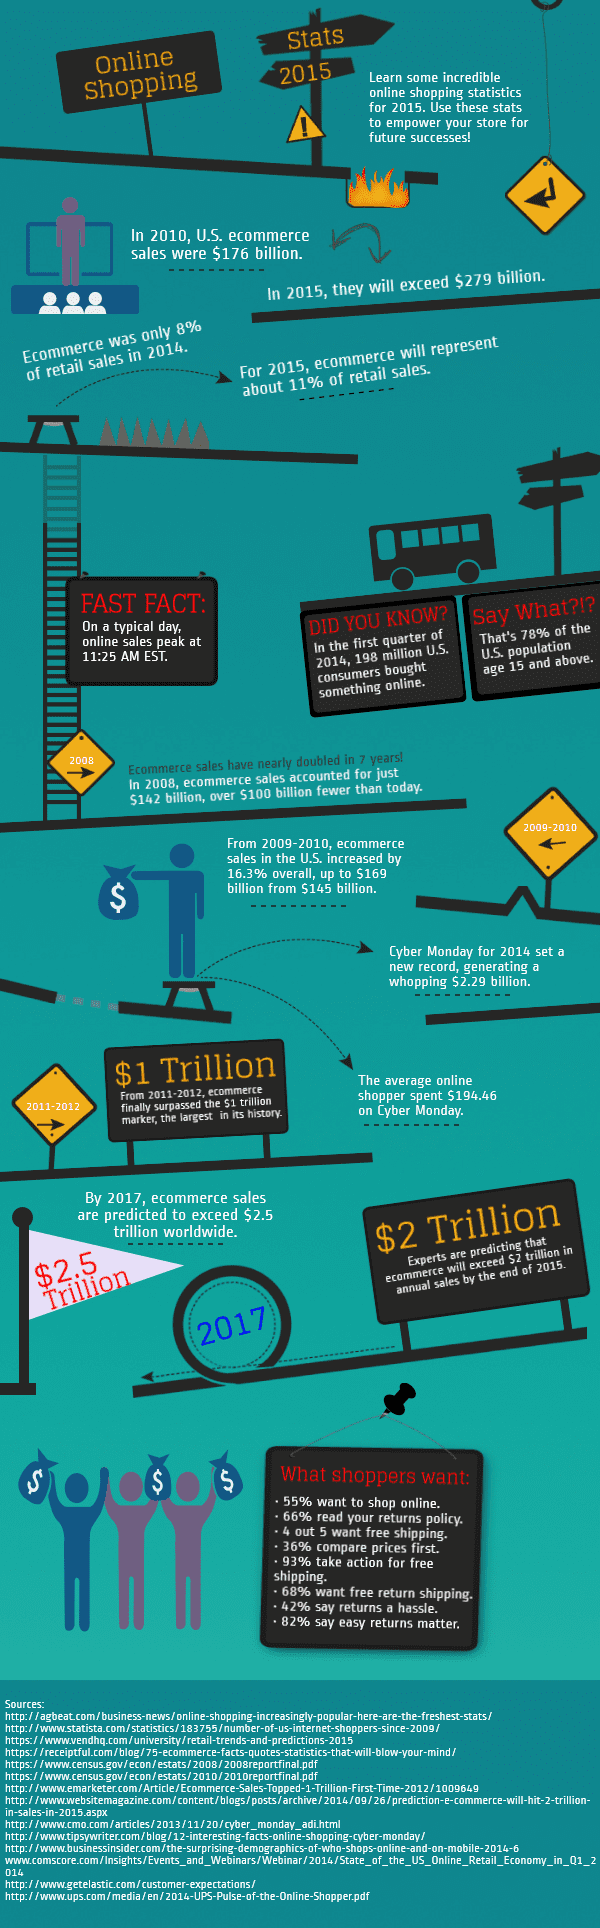
Infographic: 2015 Online Shopping Statistics
In parting, we leave you with this breakdown of 2015 online shopping stats. Learn more about what’s shaping the ecommerce world, and how it’s played out to the present day with future predictions as well as current internet shopping statistics. Find out what’s making shoppers tick, so you can make small changes to your online store to drive more conversions in your sales funnel.