
Just how important is your presence on social media? Incremental, say the most current social media traffic statistics. But what sites yield higher referral and conversion rates, which ones get the most user interactions, what ones are the fastest growing and why should you be on social media? We’ve got the answers for you in today’s guide.
The Top Contendors
If you are curious as to how powerful a beast social media has become, the current social media traffic statistics are telling, indeed. According to Search Engine Journal, as of December, 2014, the top eight social media networks were responsible for driving 31.24% of all traffic to websites.
Considering that Google leads the pack of search engines that drive traffic, seeing these numbers puts it into even greater perspective. For example, Google is the top search engine, responsible for driving 69.5% of desktop searches and 89% of mobile searches. Bing comes in second at about 27%.
When you factor that over 30% of all website visits are coming from social media, you have to also account for how many searches were conducted on those sites that generated those referral clicks. All said and done, the top eight social media platforms drive more traffic than Bing, Yahoo, Ask, AOL Blekko, Wolframapha and DuckDuckGo combined.
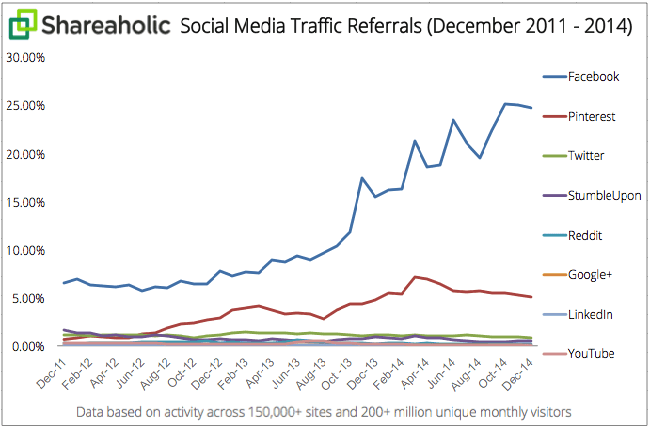
Take a look at this chart of social media traffic referrals from 2011-2014, courtesy of Shareaholic.com. You will quickly see a trend in spiking traffic over a four-year period, with Facebook, unsurprisingly, leading the pack.
Referral Dominance
When it comes to social media traffic statistics, marketers all ponder one question: Which site sends the most social media referrals?
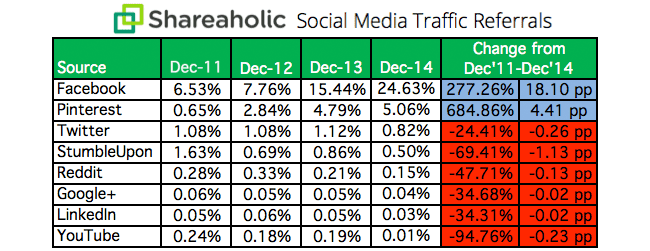
- Leading the group are the Facebook traffic stats, which accounts for 24.6% of all referrals, an increase of 277% since 2011.
- Pinterest is in second place with 5.06% of all referrals, a 684% increase since 2011.
- Twitter comes in third place with 0.82% of referrals, -24.42% since 2011.
Check out this Shareaholic social media traffic referrals chart for more clarity.
Followers vs. Mentions
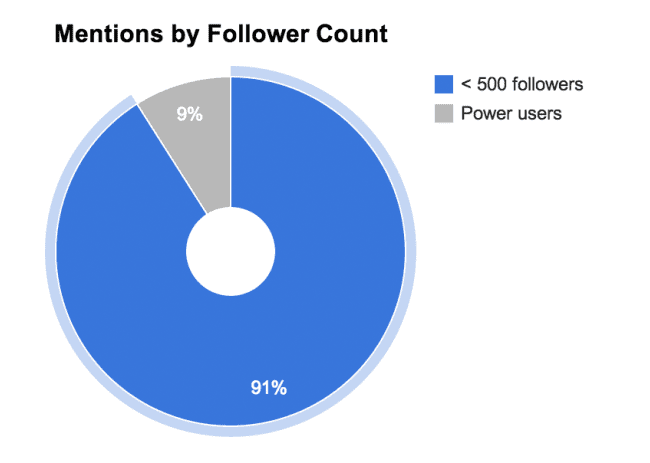
Interestingly enough, in regard to your presence and its importance, the most favorable online mentions come from social users who have 500 or fewer followers, explains a white paper that was authored by Mention, which analyzed over 1 billion social mentions over two years and found that over 90% of social mentions are derived from people who have 500 followers or friends or fewer.
Original Content Is King
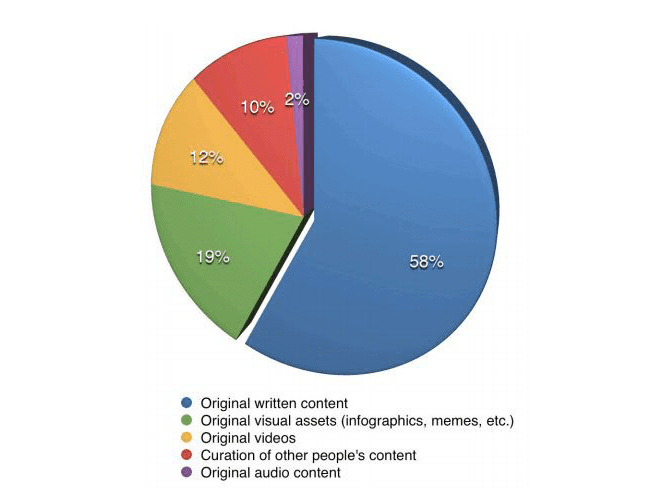
Not only do those who make the most favorable mentions have the fewest followers or friends, but they also are most prone to reading engaging, original and well-written content; not video or visual as you may have been mistakenly led to believe. In a study that was conducted by Social Media Examiner, it was found that 58% of users say that written content is the most impactful in social media.
Confounding Twitter Cluster
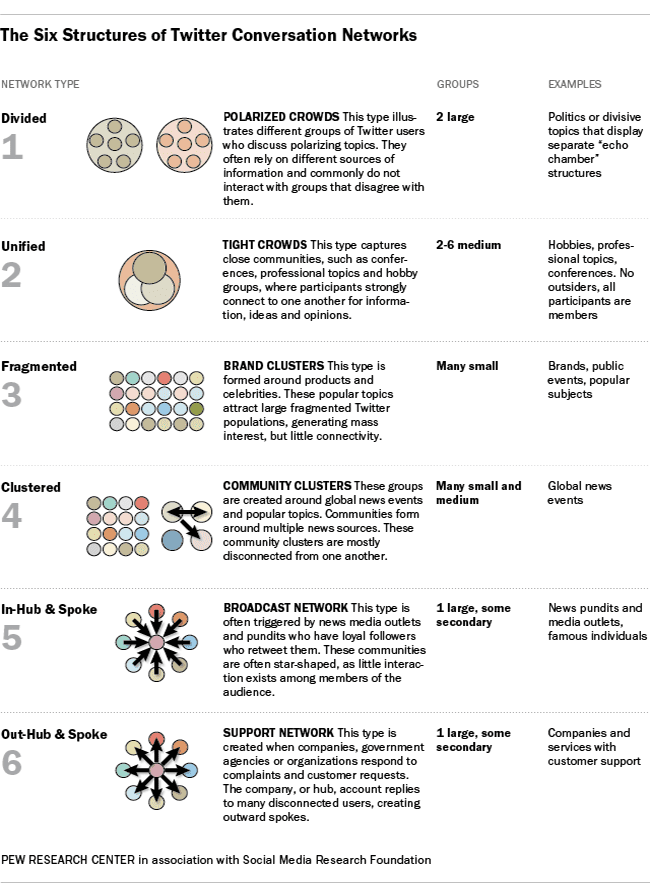
Interestingly enough, Twitter, and its innate conversations, have created a clustered moniker and nomenclature that is outright confounding. A Pew study found that there are six types of networks that create these clusters on Twitter, an important chart (below) that all marketers should study if they wish to make the most of these social media traffic statistics.
Facebook Fridays Dominate
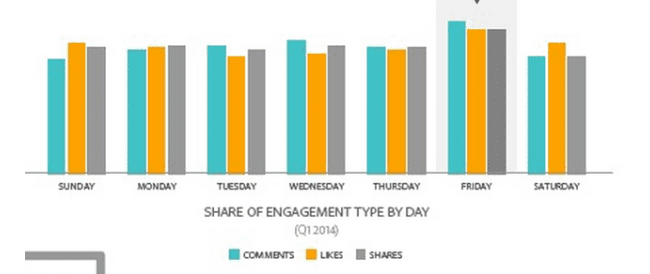
Wondering when it’s the best time to post your next viral update? According to this white paper by Adobe, that’d be Friday evening. After reviewing over 225 billion posts from Facebook, they concluded that the best day to post is Friday evening. These posts get more attention and shares than any other day or time.
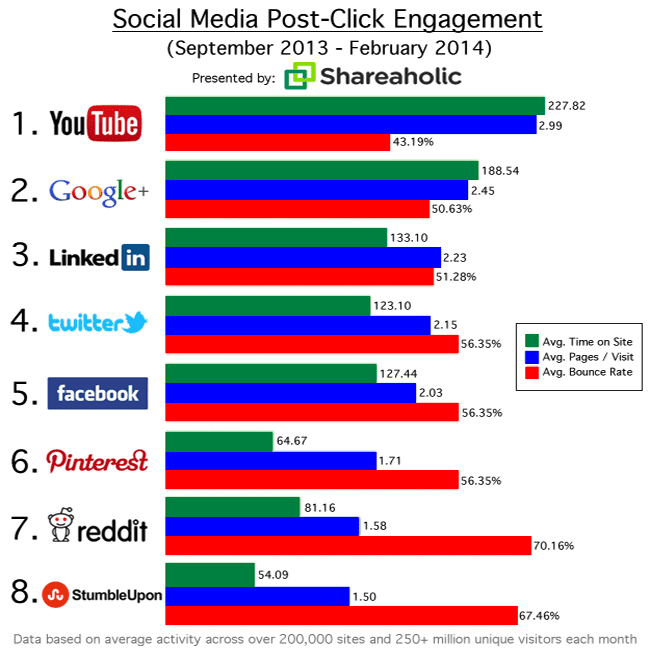
Most Post Engagements
Which site leads the pack for most post engagements? By and far, YouTube, Google+ and LinkedIn are leaders in this arena, according to Shareaholic. Combined, they generate more post engagement than any other social site.
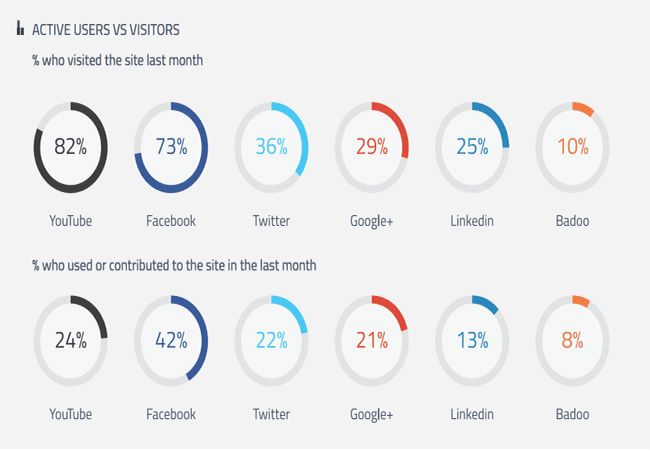
YouTube vs. Facebook
So which social media site tops the list for most impressive social media traffic statistics? Well that’d be YouTube, according to Global Web Index. Next in line is Facebook, followed by Twitter and then Google+, LinkedIn and, surprisingly, Badoo.
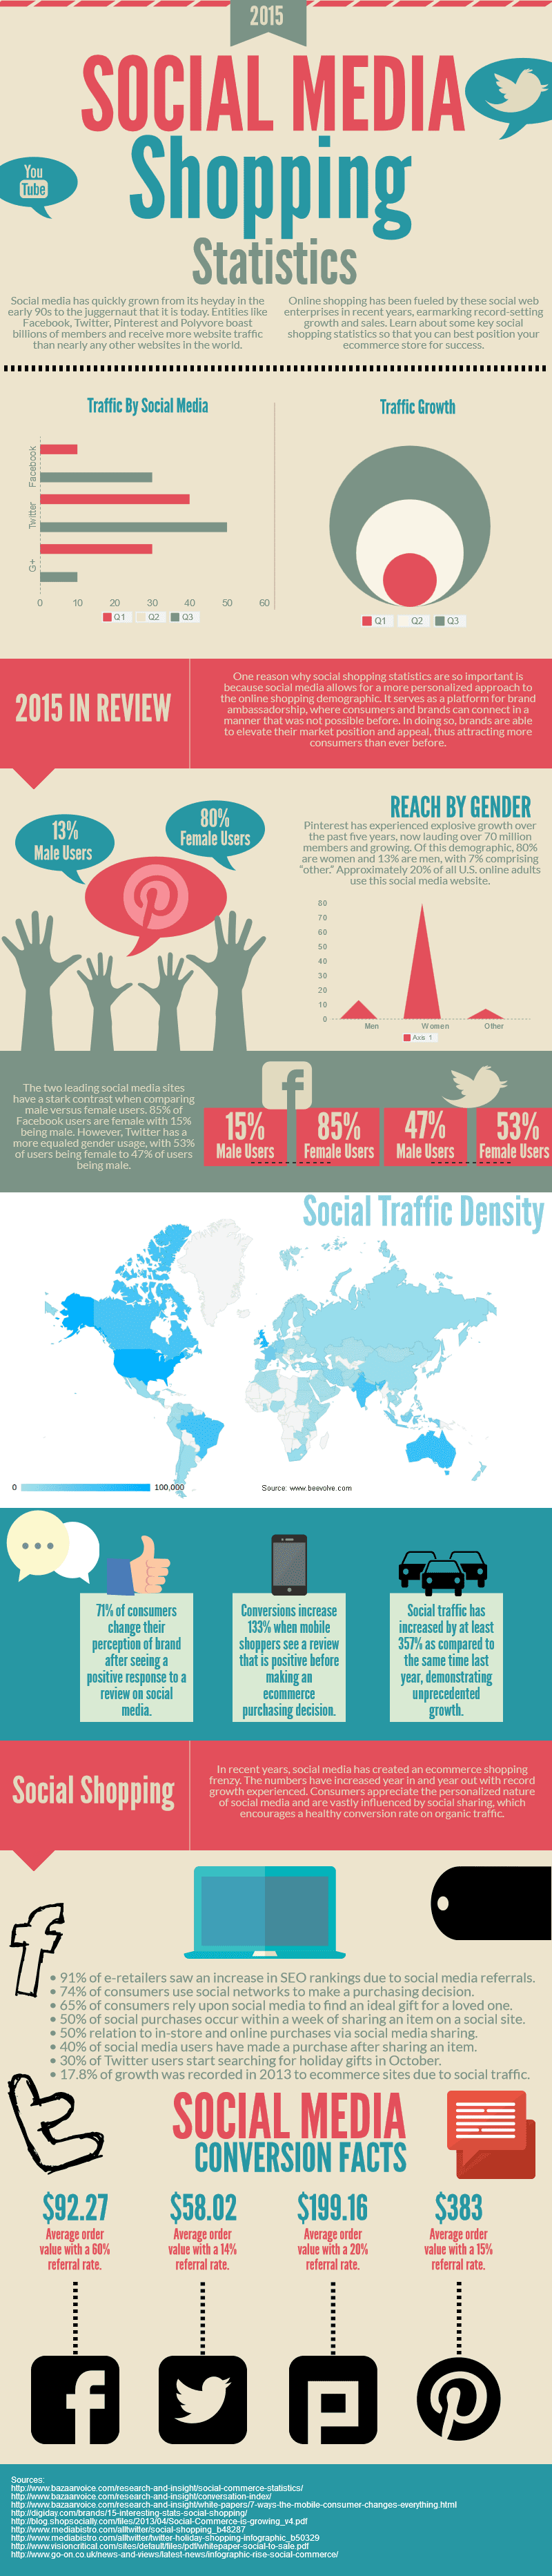
Social Shopping Statistics
We leave you with this infographic. It will help you better understand the current social shopping trends. Once you see how valuable a referral and traffic tool that social media is, you’ll assuredly want to rethink your game plan as far your presence and reach are concerned.